The Problem
Industrial systems are opaque.
Companies operate as complex, dynamic systems — but the underlying constraints that drive performance are rarely visible until after they show up in results.
- Financials are lagging indicators. By the time issues appear, the damage is already done.
- Internal reporting is fragmented, slow, and often biased toward how the business should work, not how it actually behaves.
- External stakeholders — operators, leaders, investors, partners — lack a consistent way to identify where constraint energy is building: in supply, demand, flow, or cost.
- Identifying the true bottleneck still relies on interviews, site visits, and intuition — taking weeks or months while conditions continue to change.
- There is no standard "fingerprint" for how an industrial system behaves under pressure — only anecdotes, snapshots, and delayed metrics.
As a result:
decisions are made too late
·
resources are deployed inefficiently
·
opportunities are missed or misdiagnosed
The problem isn't lack of data — it's lack of a system that turns observable signals into a coherent view of how the business is actually operating.
Core Concept
Treat industrial companies as dynamic systems that can be inferred — not just observed.
Instead of relying on internal access or delayed reporting, the platform uses observable signals to reconstruct how a business is behaving in real time.
External Inputs
Commodities · labor markets · demand signals · logistics · pricing
Behavioral Signals
Hiring patterns · content signals · operator chatter · activity patterns
Structural Inputs
Process type · industry dynamics · technology footprint
These are combined using a layered model:
Genome
System state
Identifies whether the system is resilient, constrained, fragile, oscillatory, saturated, or decoupled.
ECL
External Constraint Layer
Quantifies external pressures acting on the system — commodity cost, energy, labor, demand, logistics.
PFSL
Pre-Financial Signal Layer
Detects early behavioral signals before financial impact — inventory stress, margin compression, demand velocity.
Graph
Knowledge Graph
Connects entities, signals, constraint nodes, and outcomes across the industrial universe.
ENOX
Execution Layer
Translates insight into action via expert matching and execution pathways.
What That Enables
Early Detection
Identify constraints before they show up in financials — weeks or quarters ahead of the income statement.
Constraint Precision
Distinguish supply vs. demand vs. execution bottlenecks. Know where the energy is concentrated, not just that performance is off.
Inflection Detection
Detect early inflection points — improvement or deterioration — before they're visible in reported numbers.
Behavioral Comparison
Compare systems based on how they behave under pressure, not just sector or size. Peer benchmarking on system dynamics.
Signal to Action
Convert signals into action — investment opportunities, expert matches, and execution pathways.
20
Constraint nodes (D1–X3)
16+
Industry signal bundles
System Architecture
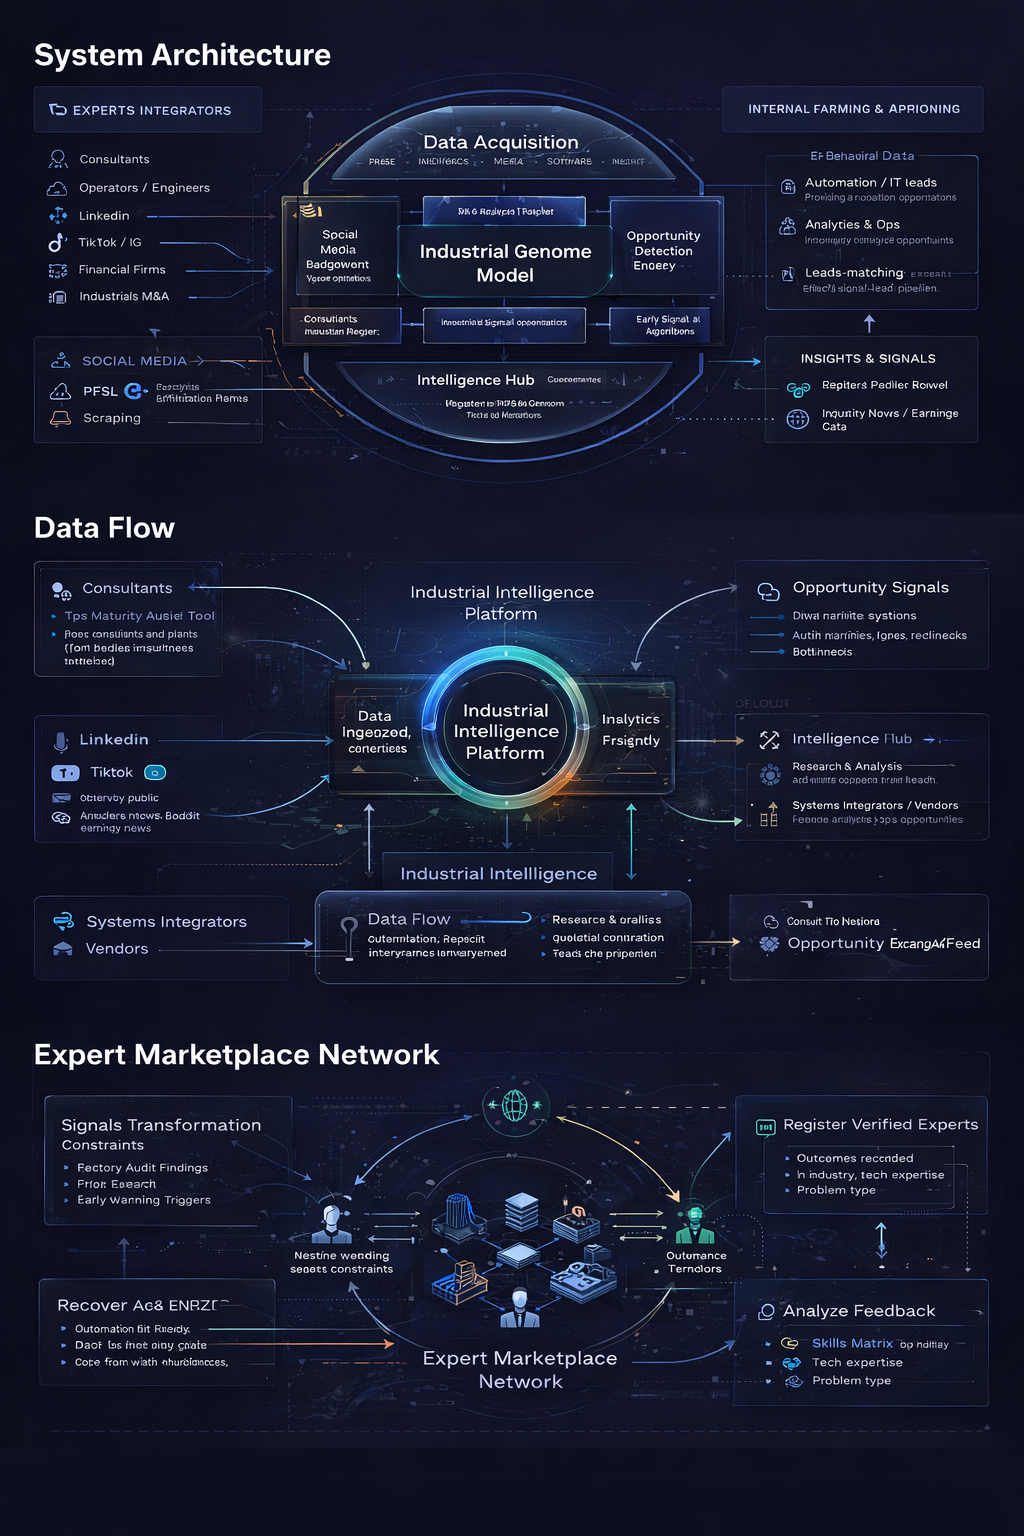
Industrial Genome platform: signal acquisition → Genome model → intelligence hub → expert marketplace
Value Architecture
A self-reinforcing data flywheel.
The more data Genome accumulates — from public signals, field assessments, and behavioral traces — the better the engine gets. Better signals attract more users. More users generate more data. The flywheel feeds itself.
Data In
Public signals
FRED · EDGAR · BLS · EIA · sector indices
Field assessments
Operators, assessors, consultants — gathering ground truth in exchange for free tools
Behavioral signals
Hiring, content, operator chatter, activity patterns
Expert network
Practitioners contributing domain knowledge, validating signals, executing recommendations
Signal Engine
→ Fingerprint each company
→ Classify archetype + trajectory
→ Score ECL + PFSL overlays
→ Compute conviction signal
→ Connect via knowledge graph
→ Match to experts + actions
Every new data point makes every other signal more accurate. The engine compounds.
Value Out
Investment signals
Conviction scores, archetype transitions, STRONG_BUY/SELL → portfolio alpha
Data insights
Sector health, constraint maps, peer benchmarks → PE, advisors, research firms
Expert matching
Constraint identified → expert matched → execution enabled → transaction fee
Consumer intelligence (Civy)
Simplified insights for retail audience; builds following that feeds more data back in
Agent API
Autonomous agents subscribe to signals, trigger actions — no human in the loop required
Participants
Different participants enter the ecosystem at different points. Some are data contributors. Some are signal consumers. Some are both. The expert network spans all of them.
Data Contributors
Operators & Assessors
Free tools in exchange for ground truth.
Ops Maturity assessments, factory walkthroughs, supplier audits — field observers use free tooling and in return generate the constraint data that makes the engine more accurate. They don't know they're building the dataset.
Signal Consumers
Investors & PE Firms
Behavioral signal before the management call.
Fingerprint 50 targets overnight. Know the binding constraint, archetype, and trajectory before the first conversation. Replace 12-week consultant engagements with a report generated in seconds.
Execution Layer
Expert Network
Constraint identified → expert matched → problem solved.
Every constraint Genome surfaces is a match opportunity. Supply fragility needs a procurement specialist. Labor constraint needs a workforce consultant. Physical constraint needs an equipment dealer. Genome routes the problem to the right expert and takes a fee on execution.
Consumer Layer
Civy / Retail Audience
Industrial intelligence for people who don't know they need it.
Simplified constraint insights, sector health scores, and company behavior patterns — packaged for a retail audience via Civy. Builds a following on TikTok and Instagram. The following generates behavioral signal data that flows back into the engine.
Autonomous Consumers
AI Agents
The end state: no human required.
Agents subscribe to conviction signals via API, execute trades, trigger alerts, route referrals — without waiting for a human to act. The signal pipeline runs continuously; agents are the always-on consumers that eliminate latency between signal and action.
Operating Use
COOs & Plant Leaders
Real-time constraint detection for active operators.
Genome quantifies where constraint energy is concentrated — supply, demand, flow, or cost. Prioritize action before the constraint compounds. Know when trajectory is inflecting before it shows in the numbers.
Products
PE Firms · M&A Advisors
Genome Studio
Diagnostic and benchmarking platform. Fingerprint any industrial company from public signals. Compare against cohort. Identify binding constraint and trajectory. Generate insight-led outreach.
Live (Early)
COOs · Operations Leaders
Operating Command
Decision support for active operators. Detect binding constraint in real time. Simulate intervention outcomes. Recommend prioritized actions with expected impact and time-to-effect.
Planned
Fingerprint Dimensions
Six dynamic properties are computed from the input/output signal pair for each entity. Together they constitute the behavioral fingerprint.
Latency
Response lag
Cross-correlation lag between input and output series. How many periods does the system take to respond to a shock?
Gain
Amplification ratio
Ratio of output % change to input % change. Gain < 1 = constrained response; Gain > 1.3 = fragile/amplifying; Near zero = decoupled.
Damping
Shock decay rate
Computed from detrended residual autocorrelation. High damping = shocks decay quickly (resilient). Low damping = persistence or cycling.
Oscillation
Dominant cycle period
FFT-derived dominant frequency in the output. Present in oscillatory systems (inventory cycles, seasonal patterns). Capped at Nyquist to suppress trend artifacts.
Saturation
Throughput ceiling
Slope-change detection in output as inputs rise. Identifies where output flattens — physical capacity, labor, or regulatory caps.
Vol. Trans.
Volatility transmission
Ratio of output std dev to input std dev (in % change terms). > 1 = amplifies shocks. < 1 = absorbs them. Key fragility indicator.
System Archetypes
Fingerprints are classified into one of seven archetypes using a priority-ordered rule set. Each archetype maps to a distinct management posture and commercial implication.
Constrained
Throughput held back by an internal bottleneck. Responds to inputs but at a reduced rate. Classic constraint signature.
Gain 0.15–0.75 · Low damping · High confidence
Oscillatory
Output cycles with a measurable period. Inventory overcorrection, demand seasonality, or planning lag.
Detectable FFT frequency · Damping < 0.55 · Period < Nyquist
Fragile
Amplifies external shocks. Small input disruptions produce large output swings. High operational risk.
Vol. transmission > 1.3 · Gain > 1.2
Resilient
Absorbs shocks without large output swings. Well-buffered with strong mean-reversion.
Damping > 0.6 · Vol. transmission < 1.1
Saturated
Output plateaus as inputs rise — hitting a physical, labor, or capital ceiling.
Saturation threshold detected · Gain > 0 · High saturation confidence
Decoupled
Output doesn't track macro inputs. Driven by internal dynamics, contract backlog, or signals not yet in the model.
|Gain| < 0.15 regardless of confidence
Constraint Taxonomy (D1–X3)
20-node canonical taxonomy for constraint classification. Each dimension in the fingerprint maps to one or more probable constraint nodes, which drive the recommended actions.
Demand (D1–D3)
End market · Channel mix · Demand stability
Supply (S1–S4)
Raw material · Capacity · Supplier concentration · Workforce
Cost (C1–C3)
Input cost · Conversion cost · Margin realization
Flow (F1–F4)
Inventory · Order velocity · Lead time · Logistics
Risk (R1–R4)
Supply fragility · Regulatory · Financial · Geopolitical
Physical (X1–X3)
Physical constraint · Regulatory cap · Capital constraint
Signal Sources
Three source bundles currently in the model. Each covers a distinct dimension of the fingerprint. FRED is the primary macro layer; SEC EDGAR adds entity-specific financial output; EIA/Baker Hughes adds energy market exposure.
| Source |
Status |
What it provides |
Industries / Use Cases |
|
FRED
St. Louis Fed public CSV API
|
Live |
Production & Capacity
INDPRO · TCU (Total Capacity Utilization)
Demand
Durable Goods Orders · Retail Sales
Cost & Input
WTI Crude · PPI (by industry)
Flow
Inventory-to-Shipments Ratio · Wholesale Trade
Labor
Manufacturing Employment (MANEMP)
|
All 16 industry bundles. Primary macro input layer for fingerprinting. No API key required.
|
|
SEC EDGAR
EDGAR XBRL financial API
|
Planned |
Entity-Specific Financials (quarterly)
Revenue (Revenues / SalesRevenueNet)
COGS + Gross Margin
Inventory Level
Capex
Operating Income
|
All publicly-traded industrials. Enables company-level fingerprinting vs. sector-level proxy only. Required for COO and PE diligence use cases.
|
|
EIA / Baker Hughes
EIA open data · BH weekly rig report
|
Planned |
Energy Market Signals
WTI Crude (weekly spot)
Henry Hub Natural Gas
Brent Crude
Baker Hughes North America Rig Count
|
Agriculture equipment (DE), heavy equipment (CAT), chemicals, oilfield services. Energy cost exposure as constraint input.
|
IP Boundary
Genome IP (this platform)
- System ID algorithms (6 fingerprint dimensions)
- Fingerprint schema + archetype classification rules
- Peer benchmarking database and methodology
- D1–X3 constraint taxonomy
- Operating Command action engine
- Commercial outreach engine (targeting → outreach → learning)
Freely portable / excluded
- FRED signal pipelines (public data infrastructure)
- LNS IPI framework, sprint structure — LNS Research IP
- LNS gold standards, CDI chat interface
- General FastAPI / Next.js patterns